RESEARCH RELEASE 0.2 / 20 OCTOBER 2026
Optical benchmark first. Alpha 1 hardware on hold. No physical coupling, apparatus performance or propulsion result is established. The next milestone is a qualified measurement of known photon momentum.
A published optical switch is not a measured thruster
Han and colleagues report 7.8% absolute efficiency at −12° and 8.4% at +45°, with 83.6% and 76.5% relative efficiencies. The fixed incident beam is at 45°, not normal incidence. Their Methods report 3.37 mW at 41.17 THz (7.281 µm), with a 213 µm beam spot. Our 80%-efficient reference is a separate assumed optical benchmark.
Research basis: Sangjun Han, 2025.
Count the light that did not enter the selected order
At 10 W, the selected-order contribution to the full state difference is −2.522 nN; at 3.37 mW it is −0.850 pN. If the rounded relative efficiencies account for all scattered power and only the two propagating orders contribute, reconstructing the other order gives −1.982 nN at 10 W, or −0.668 pN at 3.37 mW. These are derived comparisons, not reported force measurements. Finite-beam scatter, power drift and angular distributions require measurement. Neither estimate certifies operation at 10 W.
The complete momentum equation
F = (Pin ŝin − ∫ ŝ dPout)/c, with thermal radiation handled separately. The outgoing integral includes reflected, transmitted and scattered channels. For fixed incoming power and direction, ΔFx = −Δ∫sin(θ)dPout/c. Mounts, electrical leads and gas add forces outside this optical calculation.
Power scaling must also close the thermal budget
Absorption is not 1 minus the selected-order efficiency. Measure total reflection, transmission and scatter. As an illustration only, 90% absorption at 10 W means 9 W of heat and a one-state thermal photon recoil bound of 30.021 nN. The switch-dependent thermal force depends on how both states emit. Thermal expansion, fixture distortion and gas forces are not bounded by Pabs/c. A matched-heater transfer-function measurement is essential.
Averaging has a stopping point
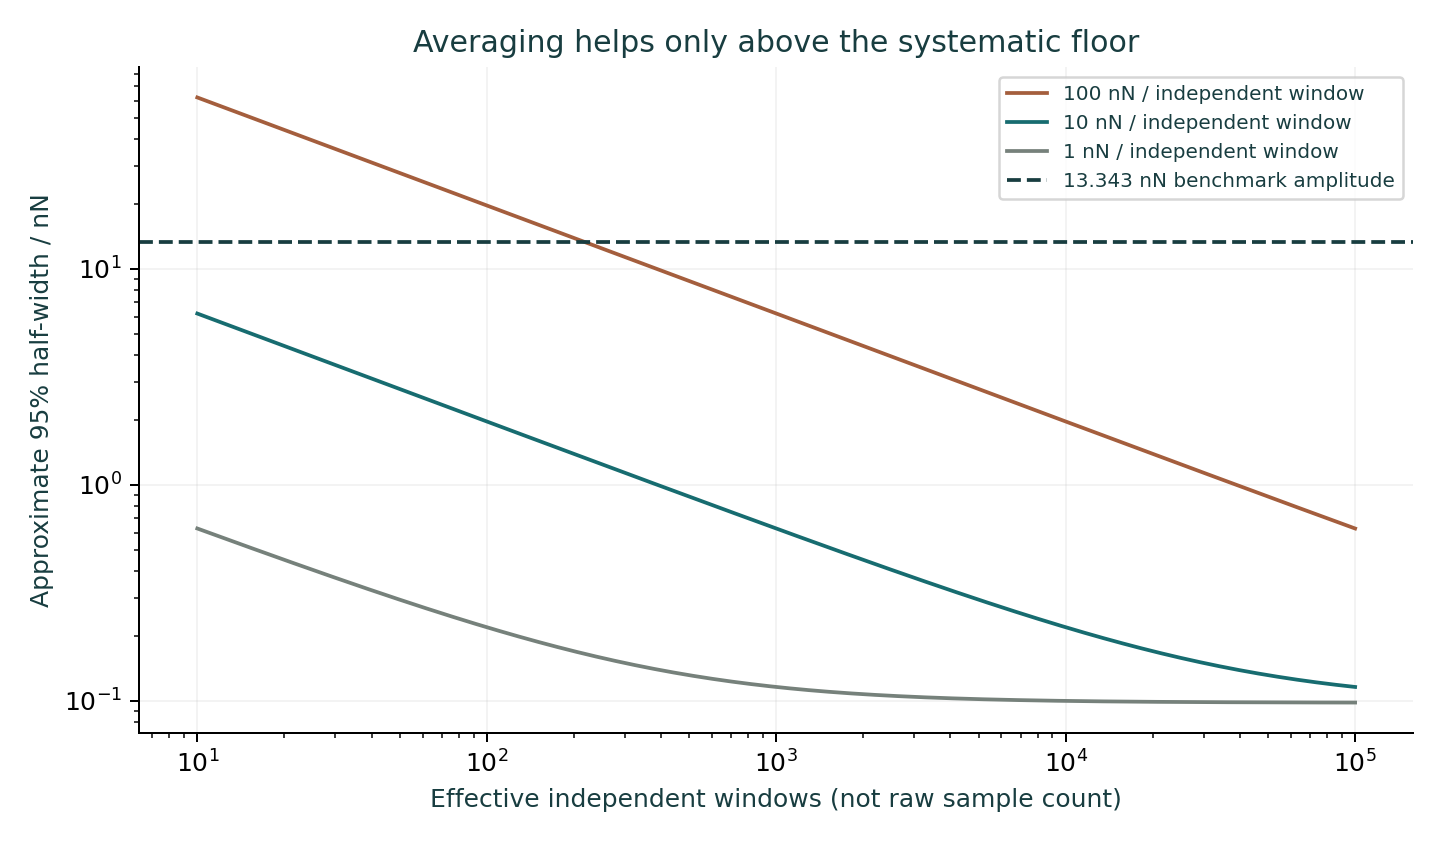
Commission 100, 10 and 1 nN independent-window noise bands as measured capability gates, not promised dates or specifications. With 128 independent windows and a 0.05 nN amplitude floor, their approximate 95% half-widths are 17.324, 1.735 and 0.199 nN. At the first band, the 13.343 nN benchmark amplitude is not separated from zero by this interval. A 217-window arithmetic illustration passes only under the same ideal assumptions; a proper experiment also needs a prospective power analysis, stable calibration and measured covariance.
A reproducible Monte Carlo budget
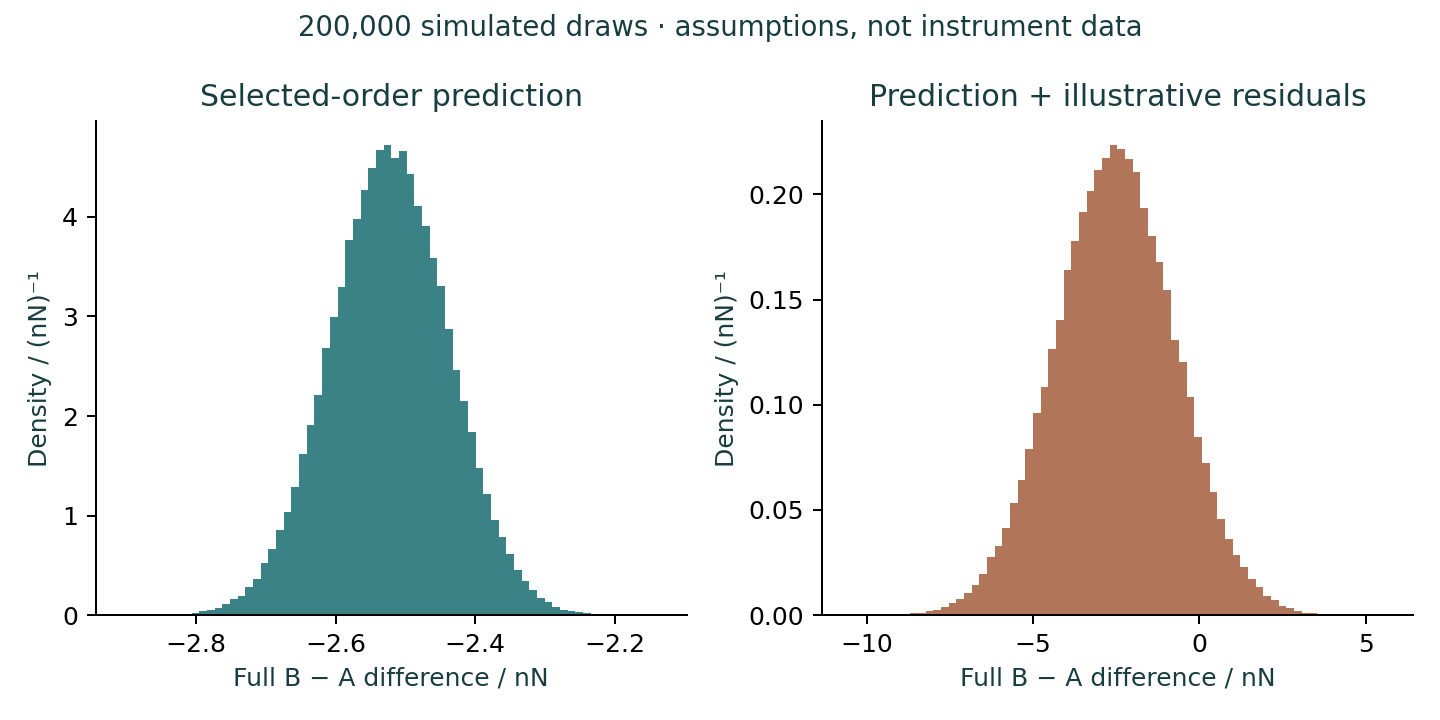
The downloadable code propagates 200,000 simulated draws. It keeps power and efficiency uncertainty separate from readout noise, thermal angular asymmetry, mount temperature response, patch drift, gas and electrical residuals. It includes correlated efficiencies and correlated thermal/mount terms. Every numerical distribution is an analyst-selected example; none is an observed MF-01 property. The current model still omits unmeasured optical channels.
Research basis: Joint Committee for Guides in Metrology, 2008 · Joint Committee for Guides in Metrology, 2008 · Maxime Monette, 2021.
| Term | Evidence needed before a real budget |
|---|---|
| Optical prediction | Measured intercepted power, full angular spectra, calibration covariance, polarization and incidence. |
| Readout and drift | Raw zero/reference records, stability versus averaging time and justified effective sample size. |
| Thermal radiation | State-specific absorbed power, temperature, emissivity and angular emission. |
| Mount distortion | Matched-heater transfer function, temperature lag, geometry and reassembly checks. |
| Electrostatic / magnetic / gas | Beam-off switching, grounded dummy, cable reversal and pressure/field sweeps. |